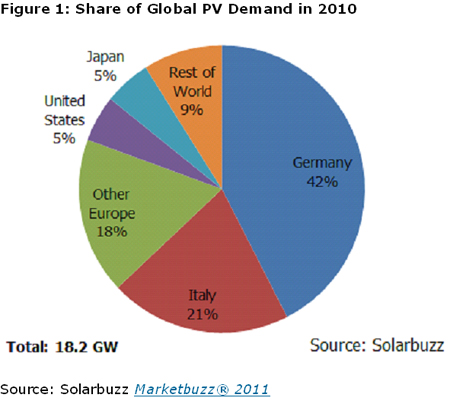
Worldwide solar photovoltaic market installations reached a record high of 18.2 gigawatts (GW) in 2010. This represents growth of 139% over the previous year, according to the annual PV market report, Marketbuzz® 2011, issued by Solarbuzz, a California-based solar energy consultancy.
The PV industry generated $82 billion in global revenues in 2010, up 105% Y/Y from $40 billion in 2009. Companies throughout the PV chain successfully raised more than $10 billion in equity and debt over the last 12 months.
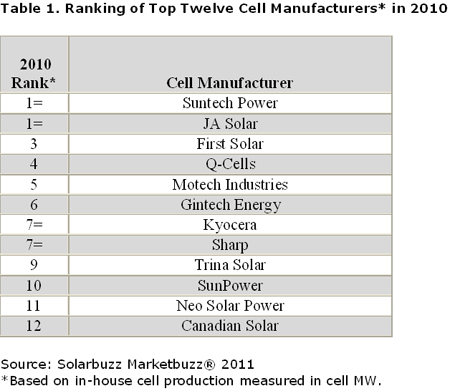
In 2010, the top five countries by PV market size were Germany, Italy, Czech Republic, Japan, and the United States—representing over 80% of global demand. European countries represented 14.7 GW, or 81% of world demand in 2010. The top three countries in Europe were Germany, Italy, and the Czech Republic, which collectively totaled 12.9 GW. In 2010, the Japanese and US markets grew by 101% and 96%, respectively. In all, over 100 countries made some contribution to soaring global PV demand last year. Worldwide solar cell production reached 20.5 GW in 2010, up from 9.86 GW a year earlier, with thin film production accounting for 13.5% of total production. Producers in China and Taiwan continued to build share, and now account for 59% of global cell production, up from 49% last year. The top two cell manufacturers in 2010 were Suntech Power and JA Solar, who tied for the first position, followed closely by First Solar. The Top 8 polysilicon manufacturers had 145,200 tonnes per annum of capacity in 2010, while the Top 8 wafer manufacturers accounted for 45% of global wafer supply. The excess of production over market demand caused crystalline silicon factory gate module prices to drop 14% in 2010, significantly less than the 38% reduction of the previous year. After addressing 2010 outcomes, the Marketbuzz 2011 report sets out three scenarios for supply, demand, and prices over the next five years. By 2015, Solarbuzz projects the European market share to fall to between 45-54% as North America and several Asian markets grow rapidly. The US will be the fastest growing major country market over this period. Over the next five years, factory gate module prices are projected to drop between 37% and 50% from 2010 levels. In the short term, assumptions about the immediate policy environment remain critical to outcomes over the next 24 months.
“The industry has now entered a phase of tightening incentive terms across important European markets. Cuts in unit tariffs will be far more rapid than the industry’s pace of cost reduction,” said Craig Stevens, President of Solarbuzz. “While some key markets will decline in size as a result over the next two years, the US, Canada, China, and Japan are some of the major countries that still offer growth potential. In addition, the rush to beat mid-year tariff reductions will ensure strong first half 2011 demand performance in Italy and Germany.” Stevens added, “Planned manufacturing capacity expansions will ensure the industry has adequate cell supplies over 2011 and 2012. However, the potential for excess supply taken together with already planned subsidy cuts will make both years challenging for the industry.” The new Marketbuzz 2011 report sets out 2010 industry outcomes and provides a forecast for the 2011–2015 period, including a preview of market developments, policies, supply requirements versus manufacturer plans, factory-gate prices, manufacturing costs, and gross margins. All of the essential data is included for companies to navigate the abrupt changes in Y/Y growth rates over the next five years.
MOST POPULAR IN LAST 24 HRS
MOST POPULAR IN LAST 7 DAYS
|